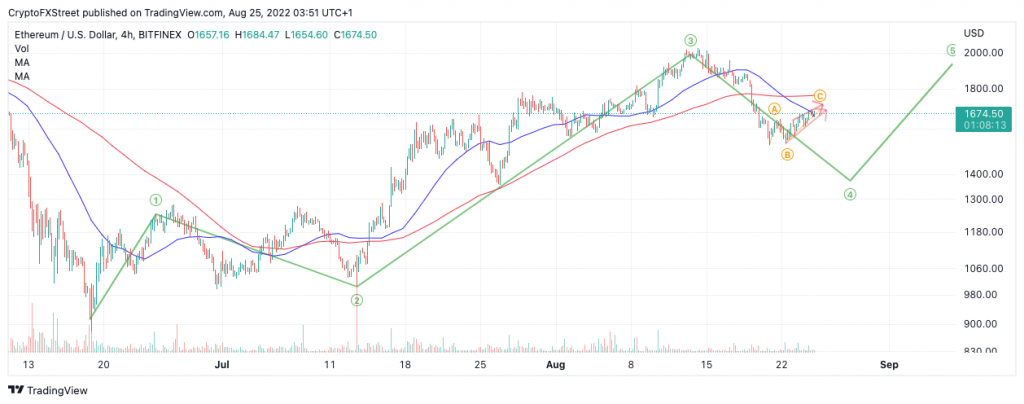
- Ethereum’s price might have one impulse wave up in the cards.
- ETH price is facing resistance below the 8-day simple moving average.
- A breach at $1250 invalidates the anticipated bullish opportunity.
Ethereum price may have one more profitable opportunity before the summer ends. Key levels for both bullish and bearish scenarios are defined below.
Ethereum’s price is a trader’s chart
Ethereum is showing optimistic signals towards the final trading days of August. Since the 25% decline occurred from $2030, the bears have managed to tag significant liquidity levels in the mid $1500 region. Post-plummet ETH’s price has already recovered 30% of the drop bringing early bulls a 10% increase in market value.
There is a chance that more upside will occur towards $1900, but an additional low between $1,350 and $1,400 would be the ideal dangerous knife-catch scenario.
Ethereum’s price currently auctions at $1660. An ending diagonal appears on the 4-hour chart. Intra-hour day traders may want to wait for a close beneath the trend line before entering a short position. The invalidation level would be the ultimate high within the diagonal pattern, currently $1692.
On the other hand, the Bulls may want to wait for a clean closing candle (on the 4-hour chart) above the 8-day simple moving average currently priced at $1685. If said price action occurs, a 14% upswing could occur towards $1950. Otherwise, it is best to have a sidelined approach and wait for A wall street discount near $1405.

Invalidation of the entire bullish thesis targeting $1950 is dependent on Wave 1 at $1250 remaining untagged. So long as $1250 is not breached, ETH’s price maintains the idea that a possible fifth wave up could still unfold.


