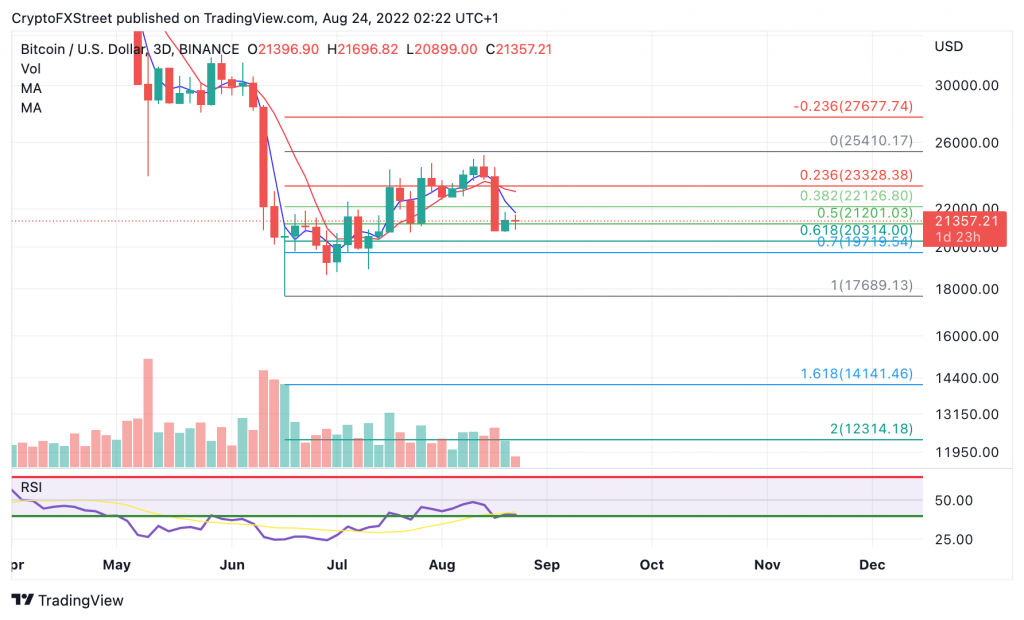
- Bitcoin has reached into the .5 Fibonacci and hovers just above the .618
- Bitcoin’s RSI has just hurdled back into the supportive buyer’s zone
- Safest invalidation of the downtrend is closing candle above $25,000
Bitcoin has fallen into a key fibonacci level after losing 17% of market value last week.
Traders should keep an eye on key levels mentioned below.
Bitcoin’s bullish scenario
Bitcoin managed to rally 41% since the June 18 low established at $17,689. Although the uptrend move was rather turbulent, An ending diagonal pattern could suffice as a first impulse wave of a larger bull run to come. A Fibonacci retracement tool surrounding the entirety of the summer time rally suggests the Bitcoin price (currently $23,357) is a 50% retracement, which is a textbook area of interest under Elliott Wave and Fibonacci theory.
Bitcoin’s bearish scenario
Bitcoin’s newly established bearish engulfing pattern is larger than all of the candles within the uptrend rally. This is a concerning signal that may be overlooked by traders eyeing Bitcoin’s price on smaller time frames. Additionally the Relative Strength Index (RSI) has just managed to climb back into a supportive zone after turbulently ascending through oversold areas. The RSI would suggest that the uptrend move is more of a countertrend rally than the start of a true bull run at the current time.
In summary
Market’s are always evolving and subject to change. Being an early buyer could be justifiable with an obvious invalidation level of $17,689. The summertime low must not get breached under any circumstances. Traders should keep in mind that the safest way to verify another Bitcoin Bullrun will be a closing candle above $25,000. In doing so the bulls could prompt a surge towards $29,000 and potentially $32,500 in the short term.
On the contrary, traders looking to join the bears could aim for the bullish invalidation point, A definitive close below $21,000 on the 3-day chart could be a subtle catalyst to induce the additional 16% decline. A wider Invalidation point would also be $25,000 to avoid any intra-hour liquidity hunts.