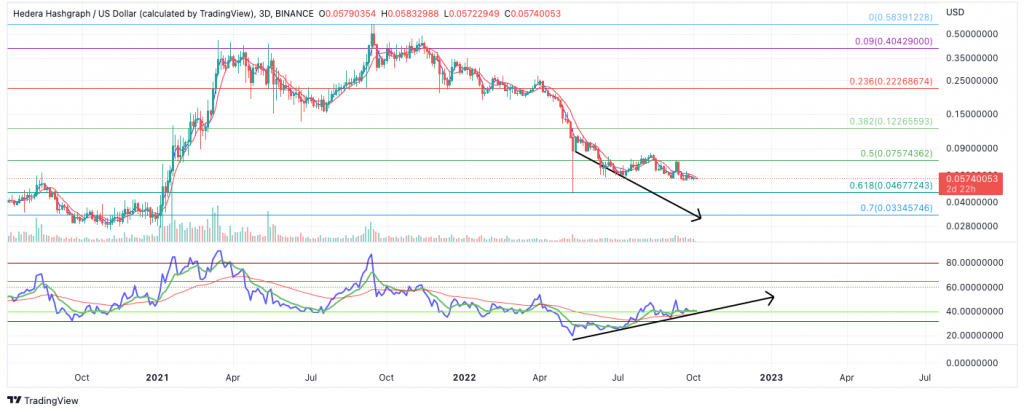
Hedera Hashgraph could be coming into a market bottom. Key levels have been identified.
HBAR price is near the lows
Hedera Hashgraph (HBAR) is one of those “keep a close eye” cryptocurrencies that could pull off good gains for both short-term and long-term investors. At writing, HBAR is witnessing a stalemate just below the $0.06 barrier. On Monday, October 3rd, the bears rejected the bullish attempt to soar higher by flexing shorts near the 8-day exponential moving average. Although the downtrend is still intact, the volume is consistently tapering off on higher time frames suggesting that the downtrend’s power could be waning off.
Hedera Hashgrah’s price currently auctions at $0.057. The Relative strength index has hurdled back above supportive levels on the 3-day chart. This could catalyze a trickle-down effect into smaller time frames creating an influx of volatility for day-traders to enjoy.

However, traders should remember that HBAR hovers between two key Fibonacci levels. The 61% Fib level of $0.046 stands 20% below the current market value, while the 50% Fib is 30% above. Orders are likely stacked near the lower level Fib, and it is very likely that if the true market bottom is here, retail traders will likely get front-run.
This thesis endorses the idea that a new low will be formed but warrants the necessity of watching the HBAR price once the new low is formed. It is possible that a V shape recovery could occur based on the RSI divergences in multiple time frames.
HBAR should have no problem rallying into the 50% Fib level if the market is genuinely bullish. However, the 38.2% fib level could also get tagged towards $0.12 in the coming weeks resulting in a 100% profit. If the market bottom holds, HBAR could be on its way towards $1.00 as early as Q1 2024. Once the new low occurs, invalidation of the knife-catch scenario will be the $0.03 thrust candle that occurred in January of 2021.


